


Mauboussin on Drawdowns
A Deep Dive into Risk Management and Long-Term Returns

In the last two weeks, we explored how The Children’s Investment Fund (TCI) implements a barbell strategy—investing in high-octane growth stocks at a fair price while also allocating to more defensive investments. As we discussed, many top-performing funds tend to focus on the high-risk side of the market to deliver strong returns during bull markets but often face significant drawdowns in bear markets. TCI, on the other hand, achieves strong returns by balancing 50% of its portfolio in higher-risk assets and 50% in highly defensive businesses, like railroads and airports—a textbook example of a barbell approach that serves as a useful tool to limit drawdowns.
Recently, one of my favorite authors published an insightful paper on drawdowns, which I'd like to dive into today. It offers an important framework for understanding the relationship between risk and reward in long-term investing.
A Munger Quote to Start:
The paper begins with a powerful quote from Charlie Munger, which has been distilled into the following insight:
Big drawdowns are a price to pay for superior longterm investment returns.
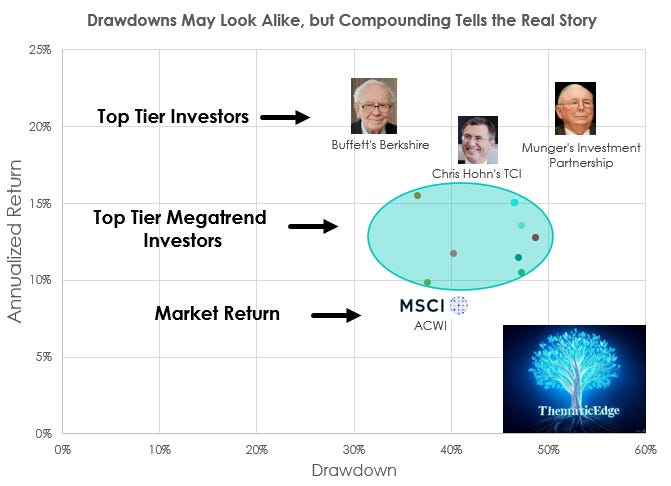
We know what superior long-term returns look like: Munger’s investment partnership, Buffett’s Berkshire Hathaway, and Chris Hohn’s TCI have all delivered annualized returns of 18-20%. But what about the drawdowns that these strategies have experienced along the way?
Munger’s Investment Partnership: 53% drawdown in 1973/1974
Buffett’s Berkshire Hathaway: 32% drawdown in 2008
Chris Hohn’s TCI: 43% drawdown in 2008
In the chart below, you can see how Buffett’s return and drawdown profile stands out. His annualized return is world-class, yet his drawdown during 2008 was relatively mild compared to peers — including the MSCI World Index (often referred to as the "ACWI"), which serves as a benchmark for the average investor.
I’ve also added the best-performing megatrend funds over the past 20 years. In an upcoming newsletter, we’ll take a closer look at the leading thematic investors behind those results.
While the drawdown patterns among top-tier investors, top megatrend funds, and the broader market often appear quite similar, the real differentiator is the compounding during bull markets. That’s what ultimately sets the best apart.
Key Insights from the Paper
The paper provides interesting context at the portfolio level. For example, Mauboussin presents a table that shows the median maximum drawdown for a U.S. stock between 1985 and 2024 was an astounding 85%. It’s important to note that this is not based on “the worst year” for an investor as we used it for our analysis, but instead calculates the drawdown from peak to trough.
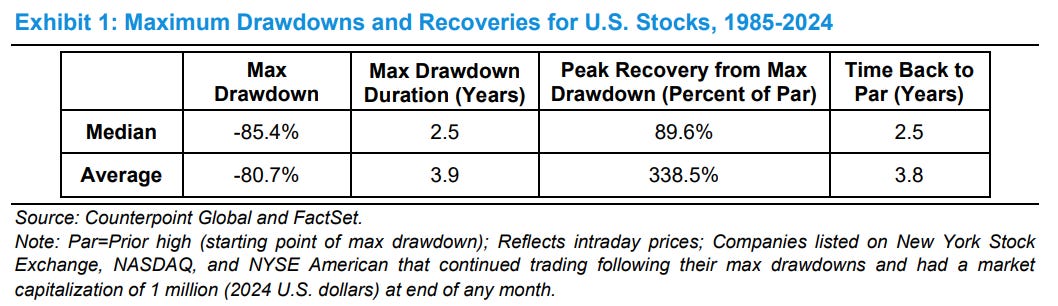
Some additional key points discussed in the paper:
The bigger the drawdown, the longer it takes to recover.
The bigger the drawdown, the stronger the bounce back.
A particularly striking table compares the best and worst total shareholder return stocks from 1985-2024. If you had timed the market perfectly and bought a stock at the bottom, the resulting returns would have been extraordinary.
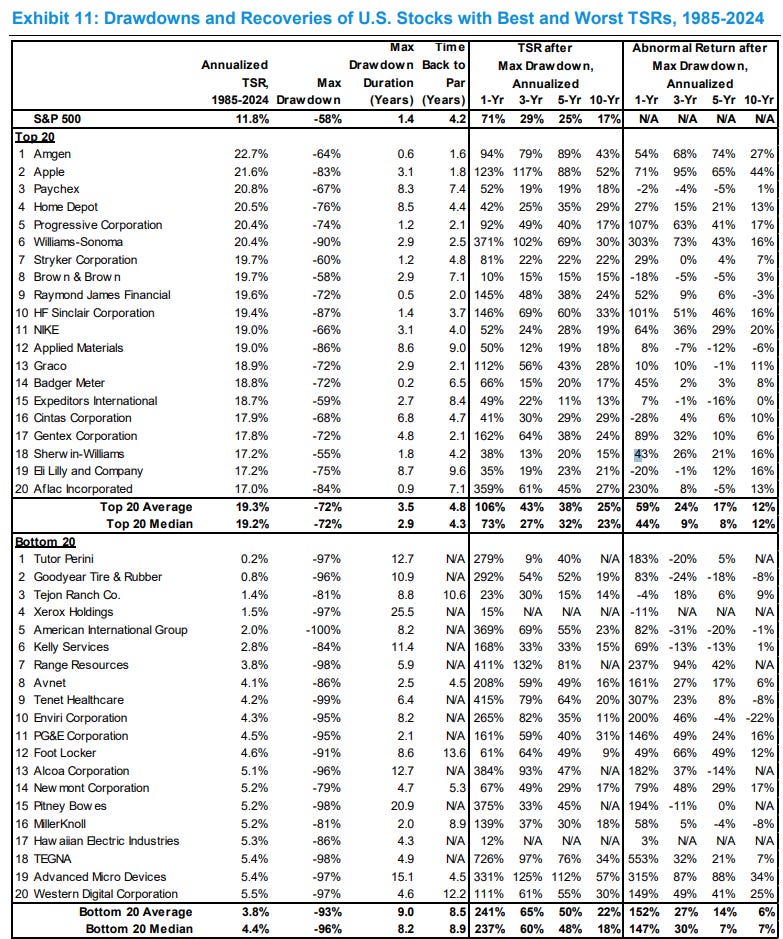
This serves as a good reminder that sometimes it’s worth considering stocks under severe short-term pressure, as they may bounce back and continue to compound.
But Mauboussin also found the right quote (Bernard Baruch):
Don’t try to buy at the bottom and sell at the top. It can’t be done except by liars.
Practical Insights: What to Look for at the Bottom
The final section of the paper offers a practical guide for identifying good investment opportunities during market downturns. Here’s a useful checklist:
Are the fundamental issues cyclical or secular?
What does the basic unit of analysis tell you about the business?
How lumpy are the investments in the business?
Is there sufficient financial strength?
Is there access to capital if needed?
Is management clear-eyed about the challenges?
It’s a solid framework, and if you want more granularity, I suggest taking a look at page 19 of the paper.
Takeaway for My Own Investment Strategy
This paper has inspired me to work on creating a basket of stocks with strong secular growth tailwinds, while also considering their correlation profiles within various megatrends. I think this could be a promising area to explore for the riskier part of the barbell.
For the more defensive part of the barbell, I’m looking into combining truly defensive companies (e.g., railroads) with well-managed, slow-growing businesses that pay an attractive dividend yield. I’m curious to explore how such a model portfolio can be structured to mitigate large drawdowns while still targeting mid-teens total shareholder returns over the long term.
Don’t Miss Out
If you’re looking to stay ahead of the curve in thematic quality growth investing, subscribe today to receive fresh, insightful posts straight to your inbox.
Thanks for reading ThematicEdge! Your support means a lot.

If you enjoyed what you read, feel free to share it with your friends and colleagues!